How do I connect cells and expression data?#
You want to compute a summary statistic for your cells from a subset of genes, or you want to identify genes that are differentially expressed between two subsets of cells. Because cells and genes are only connected through their expression matrix, glue genes needs to do a calculation to make these kinds of connections, and you have to use a dedicated plug-in to tell glue how to do this calculation.
Create a summary of gene expression over cells#
Create a subset over some genes of interest. This is just a starting point; the subset can subsequently be updated. This subset must be defined on the genes in the single cell data set, either because it is a direct selection of these genes or because it is a selection on another dataset that is appropriately joined to the gene expression data in the single cell data set.
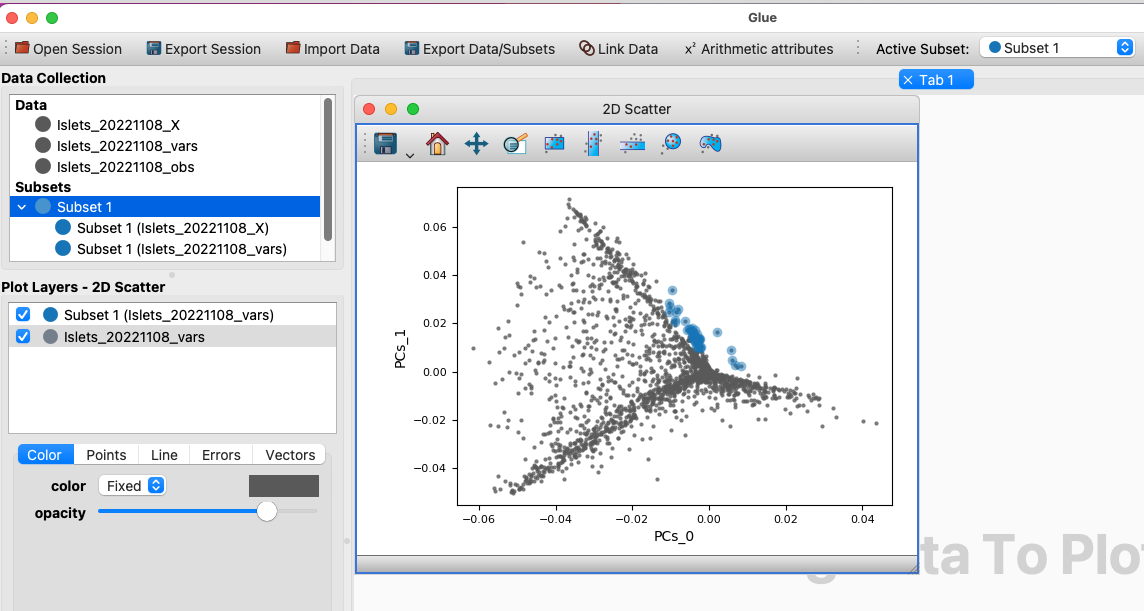
Create a subset over the genes in your single cell data set.#
Choose the Calculate Summary Over Gene Subset menu item from the Plugins menubar item. In the dialog window that pops up, make sure that the correct dataset for the cells is selected, as well as the subset that you just defined over genes. Finally, choose the summary statistic you want to use. Mean Value is fastest if you have very large datasets, but Module Score or PCA do a better job of specifically highlighting the cells where the genes are differentially expressed.
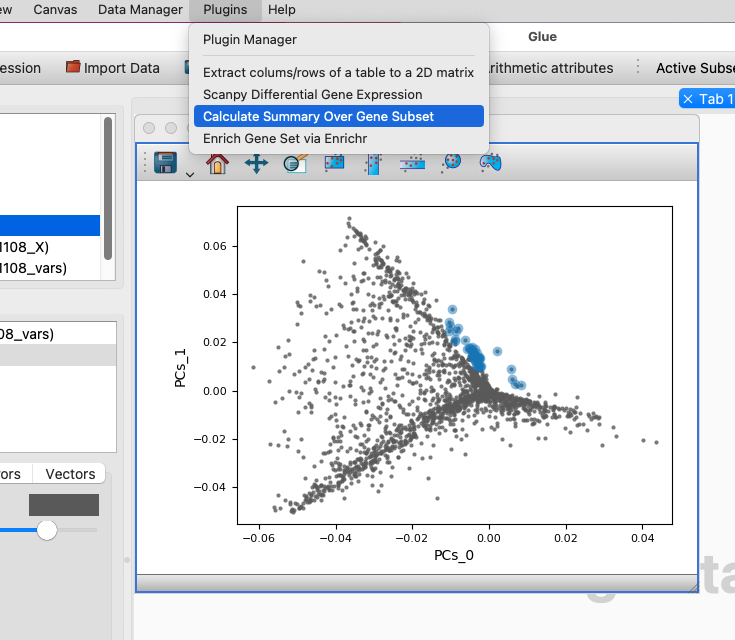
Choose the Calculate Summary Over Gene Subset menubar item.#
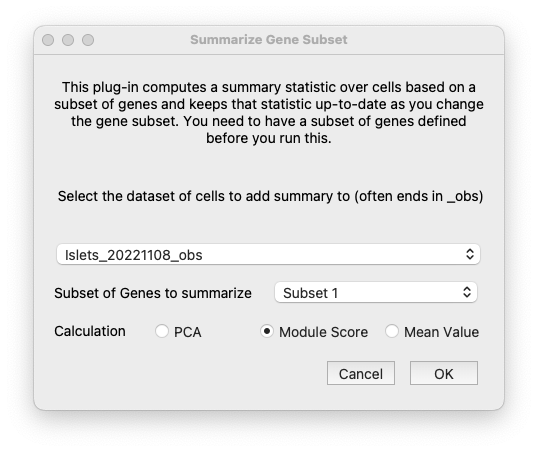
Choose the parameters for the summary calculation.#
A dialog will tell you that a new component has been added to your cells dataset. This new component contains the summary statistic for the gene subset, and will update as the gene subset changes. You can now either use this new component as a Linear color-scale in a visualization of the cells or plot this new component on one axis of another Viewer. Now explore what happens to these views as you update the gene subset.
Identify differentially expressed genes between subsets of cells#
Create one or more subsets of cells you want to compare.
Note
If you want to calculate differential gene expression for a subset of cells versus all the rest of the observations, just leave Subset 2 on the default value of “Rest (all other observations)”.
Choose the Calculate Differential Gene Expression menu item from the Plugins menubar item. In the dialog window that pops up, make sure to choose the X matrix (gene expression matrix) for these subsets of cells, identify the component that contains the gene names or IDs, and select the two subsets of cells as Subset 1 and Subset 2.
A dialog will tell you that two new components have been added to your genes dataset. These new components give the z-scores and adjusted p-values for the differential gene expression between the two subsets of cells. You can now either use these new components as linear color-scales in a visualization of the genes or plot these new components on one axis of another Viewer. As you update the subsets of cells, these new components will update to reflect the new differential gene expression.
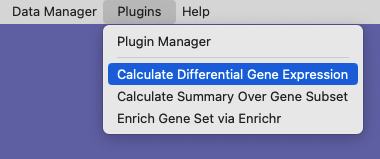
Choose the Calculate Differential Gene Expression menubar item.#
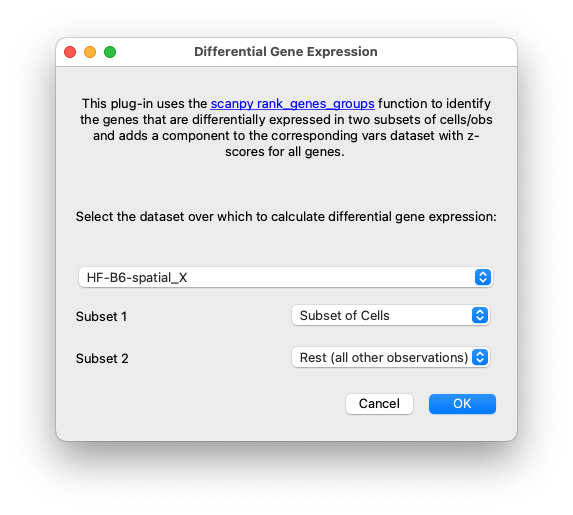
Set up the datasets and subsets for running differential gene expression.#
The z-scores and adjusted p-values can be used to define new subsets of genes that correspond to genes which are significantly differentially expressed between the two comparison subsets.