glue genes User Guide
This User Guide explains the core features of glue genes. For more details on how core glue works, see the core glue documentation. Please note that this User Guide is a work-in-progress.
New Data Loaders
Single-Cell Data
glue genes supports loading single-cell type data via the AnnData package. Since glue requires that all data objects should have components of equal dimension, the AnnData data loader parses the underlying AnnData object into linked glue data objects as shown below:
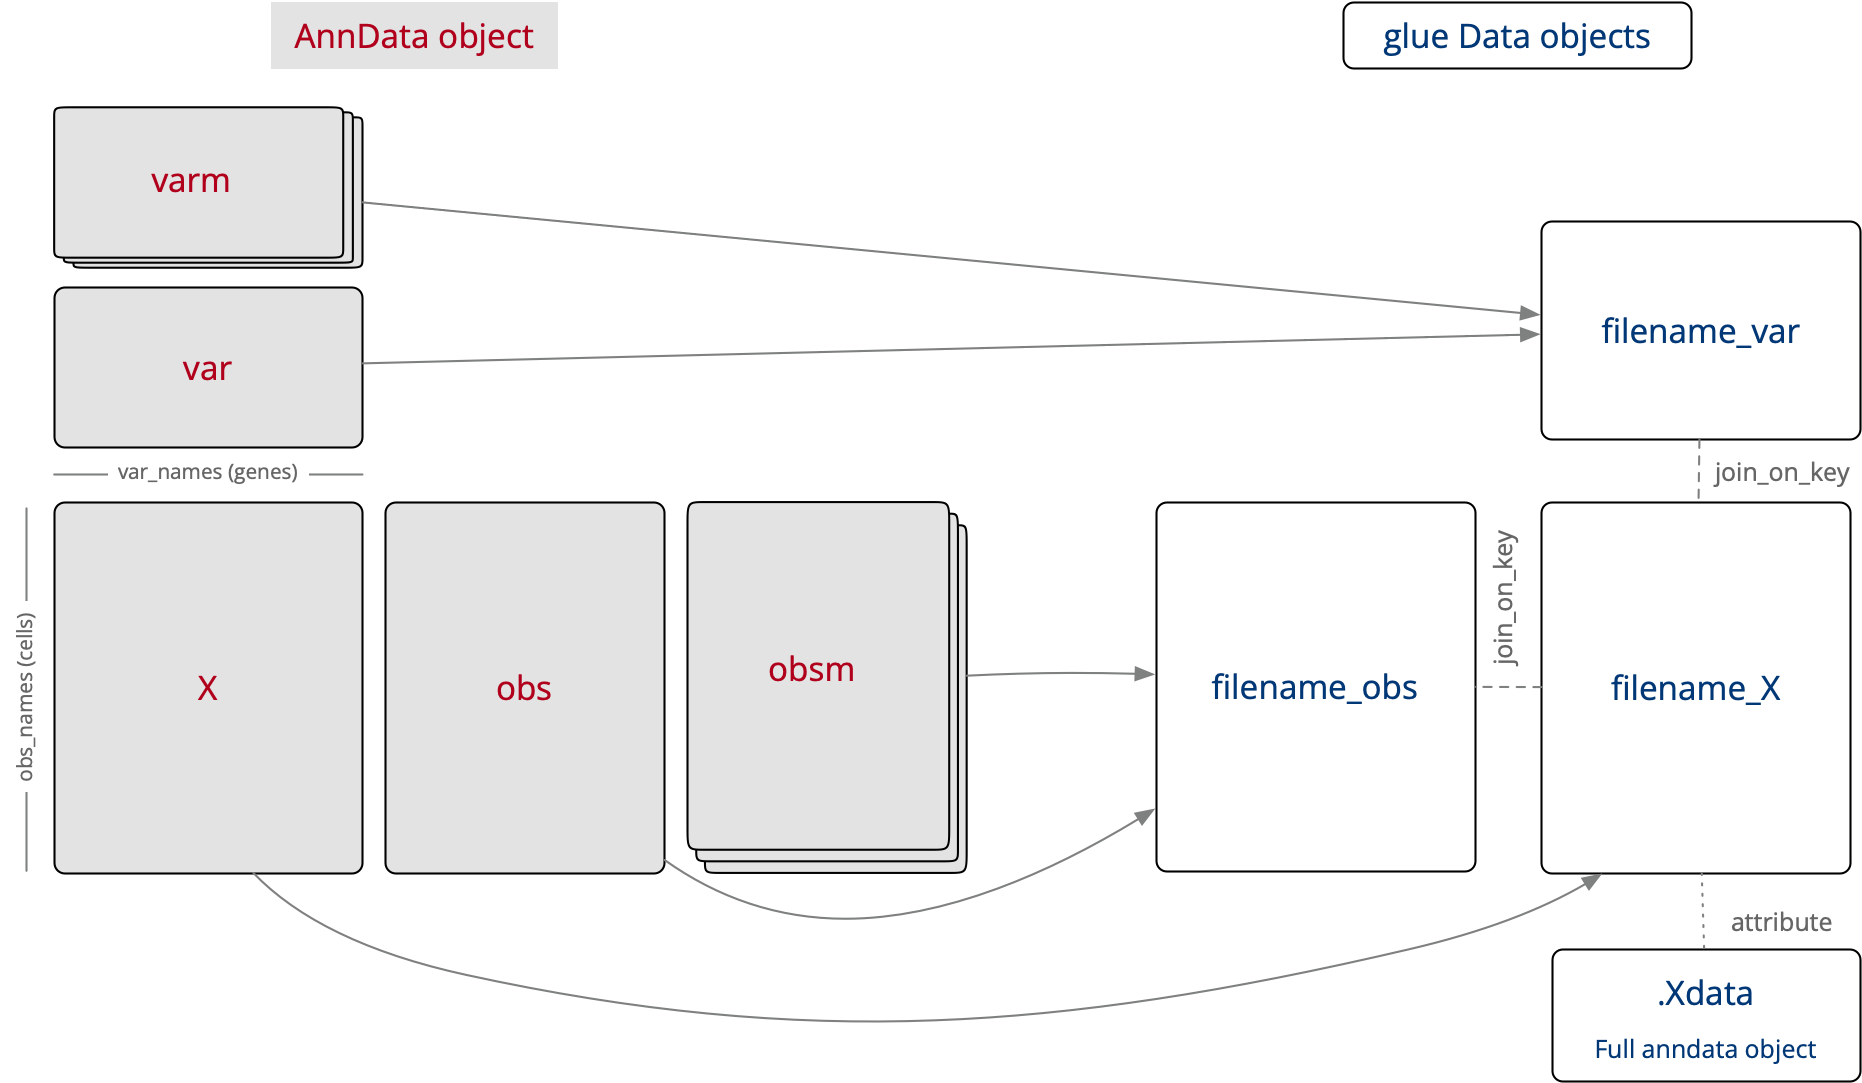
How the pieces of AnnData object map onto glue data objects
The 2D X matrix can be visualized in a Heatmap Viewer, and is used to connect the gene (var) and cell (obs) 1D data tables through the use of analysis plug-ins.
Spatial Transcriptomics Data
glue genes supports loading spatial transcriptomics data via the Squidpy package. Currently this supports loading SpaceRanger output folders and will create 4 linked datasets – the three datasets described above in the section on Single-Cell Data and the “Hi-res” image.
More complex and not-yet-supported spatial data sets can still be loaded via transforming the underlying data into an AnnData file, and loading that into glue genes alongside the underlying image data and gluing them together.
Imaging Data (Tiff-like, OME-Zarr, OpenSlide)
glue genes supports loading in image data using several libraries, including Tifffile, OME-Zarr, and OpenSlide (if the underlying OpenSlide library is installed). Where the underlying formats support it, these datasets are lazy-loaded as Dask arrays, providing for efficient viewing of datasets significantly larger than the available RAM.
BED and BigWig Data
glue genes uses the pyranges package to support loading BED and BigWig data files. Because the BED file format is quite flexible but lacks metadata, glue genes does not attempt to guess names for most of the components. The first three components get the predefined names, and subsequent components are left for the user to rename.
New Viewers
QTL Viewer
The QTL (quantitative trait locus) Viewer is a customized version of the 2D Scatter Viewer with two main additional features: chromosome markings and LOD score filtering. The Viewer is specifically designed to work with datasets obtained from the Churchill Lab QTL Viewer, but will generally work with any QTL dataset that contains gene and marker positions that are monotonically increasing (i.e. describing a position along the full genome rather than just within a chromosome).
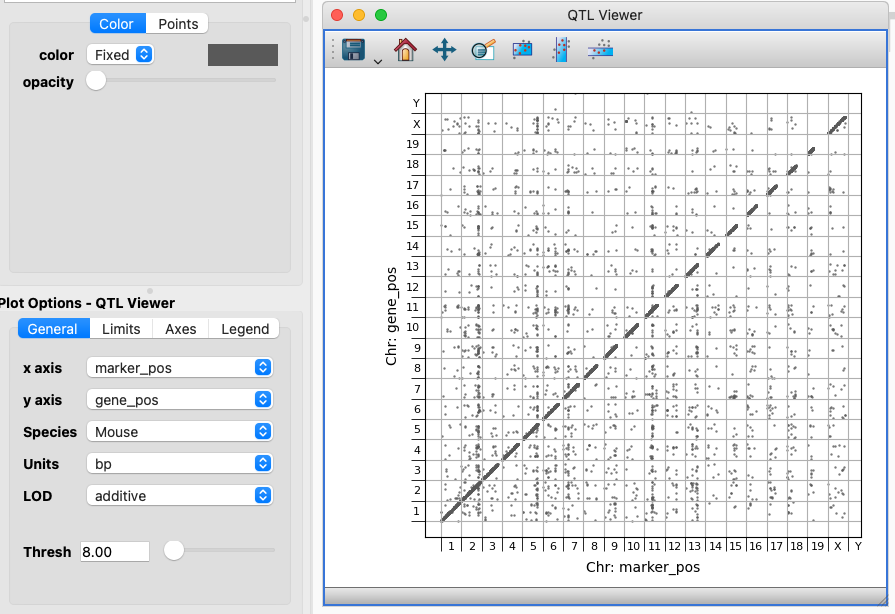
The QTL Viewer and options
The QTL Viewer is designed for the monotonically increasing marker and gene positions to be plotted on the X and Y axis. In this setup a Species can be selected to show the chromosome divisions. If your data describes positions in a different unit that can be configured.
If your dataset contains one or more LOD (logarithm of the odds) scores, then you can select the appropriate component and filter using the Thresh slider or input field to limit display to associations with higher significance. Selections/subsets defined using this viewer will also include the Threshold value. That is, if you filter the data to only show more highly significant associations then a subset with that filter in place will only include the points you actually see.
Heatmap Viewer
The Heatmap Viewer is an extra Viewer bundled by default with glue genes for the display and analysis of matrix-type data. The primary use for this viewer in glue genes is to visualize the gene expression matrix in a single-cell or spatial transcriptomics dataset.
Warning
The Heatmap Viewer transforms the underlying matrix data (which may be sparse) into a dense 2D array; this can consume a very large amount of memory. Future work will reduce the memory overhead of this viewer.
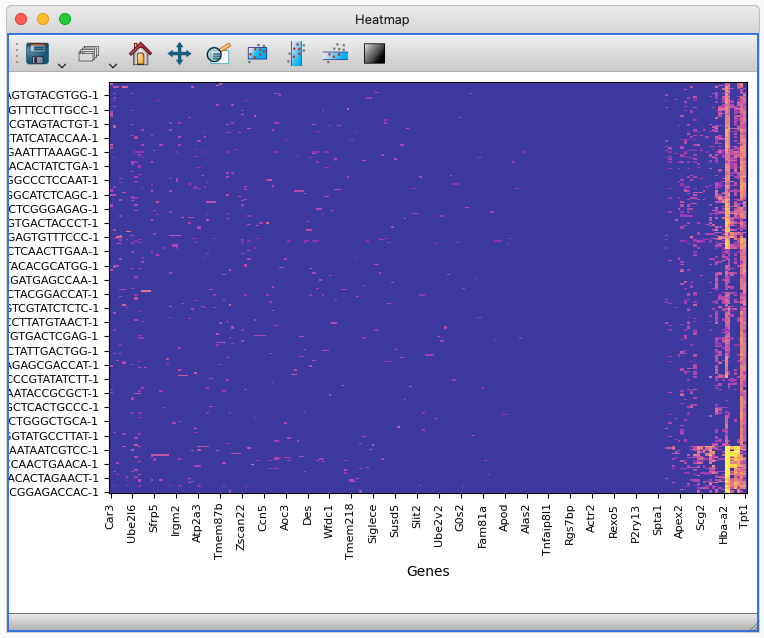
The Heatmap Viewer display the gene expression matrix for a spatial transcriptomics dataset.
Small Multiples Viewer
The Small Multiples Viewer is an extra Viewer bundled by default with glue genes for the display of 2D scatter plots faceted by categorical variables. For instance, in the single cell context you might display properties of cells in a 2D scatter plot faceted by one or more experimental factor. A Small Multiples chart is sometimes referred to as a Facet plot of a Trellis plot.
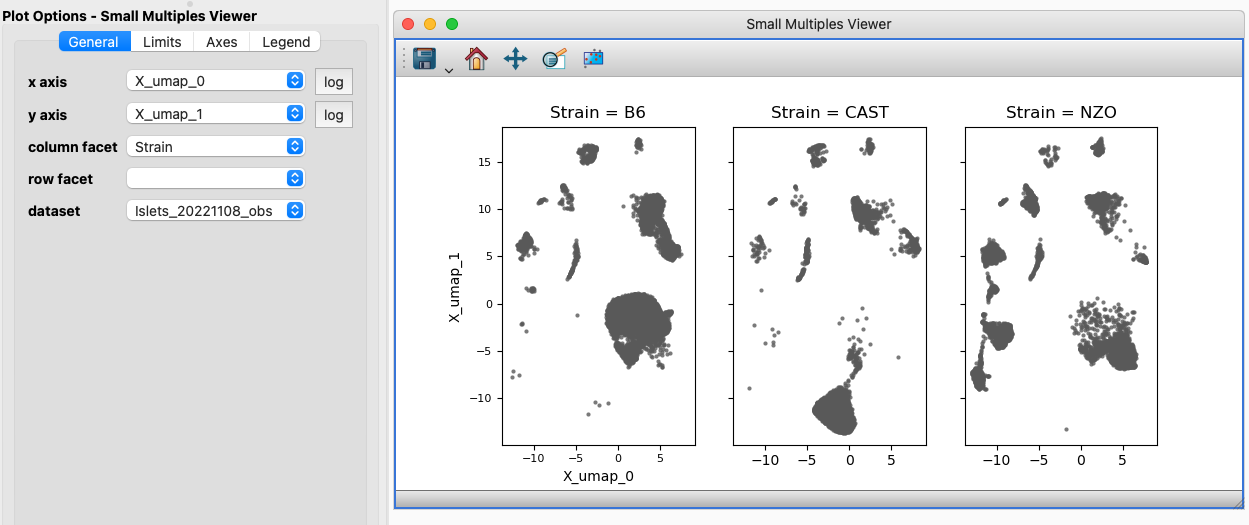
The Small Multiples Viewer and options. Here we are just faceting out the columns based on a categorical component, but it is also possible to facet on a second component and get a grid of small multiples.
Note
Selections/subsets made on a Small Multiples Viewer will be the combination of the area selected and the value of the categorical component displayed in that small multiple. The combination of a 2D Scatter Viewer showing all the data and a Small Multiples Viewer provides for an excellent “compared to what?” context for subsets.
Analysis Plug-ins
The analysis plug-ins bundled with glue genes can be broken down into two categories: those designed for single cell analysis and those that are more generally applicable.
General Plug-ins
Enrich Gene Set via Enrichr
This plug-in uses the enrichrpy library to query the Enrichr API for Gene Set Enrichment Analysis. Currently this plug-in supports retrieving KEGG pathways for a particular set of genes and returns a full glue data object with the results of the query which is automatically joined-on-key to the dataset where the gene subset was drawn for.
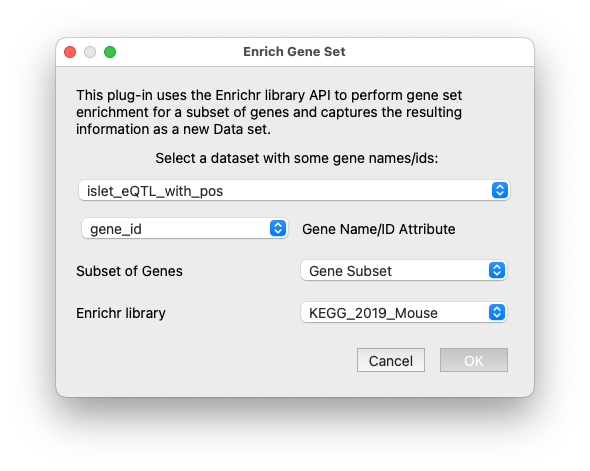
The interface for the Enrichr plugin.
Single Cell Analysis Plug-ins
Differential Gene Expression
A basic guide to using this plug-in is here
Calculate Summary Over Gene Subset
A basic guide to using this plug-in is here